Comments Off on GIS is Rewriting Archaeology Approaches
Geographic information science (GIS) has made a monumental impact in fields like the earth sciences and historical research. Archaeologists were among the earliest adopters of GIS, beginning to utilize geospatial technology for projects in the 1980s. Since then, GIS has continued to change archeology approaches for the better, opening new avenues for discovery and providing a new perspective on the world around us.
As GIS mapping technology has become more powerful, it has become commonplace to develop visualizations of ancient settlements and analyze changes in the use of space over time without risking damage to the artifacts. But the revolutions of today aren’t just about creating better maps: new approaches in GIST have allowed researchers to survey enormous areas, look under things (trees, water, ice, ground) that we couldn’t before and in many cases, not cause any disturbances to sites.
Today, researchers harness emerging spatial problem-solving techniques like GeoAI and machine learning, LiDAR and predictive site mapping to uncover hidden pieces of history and develop fresh insights into known settlements.
Request Brochure
Fill out the information below to learn more about the University of Southern California’s GIS Graduate Programs and download a free brochure. If you have any additional questions, please call 213-325-2474 to speak to an enrollment specialist.
The Use of GeoAI and Machine Learning in GIS and Archaeology
Modern machine learning and GeoAI tools have made GIS even more powerful than previous generations of archeologists could have expected. By using deep learning models to analyze existing images of the area, the AI can predict the locations of archaeological sites with roughly 80% accuracy. In the hands of an experienced archaeologist, these predictions can be used to develop heatmaps or streamline further analysis using GIS software.
These tools are already being used to make the workload of analyzing existing data more manageable in projects like “Cultural Landscapes Scanner (CLS): Earth Observation and Automated Detection of Subsoil Undiscovered Cultural Heritage Sites via AI Approaches,” which was conducted by the European Space Agency with the goal of detecting undiscovered cultural heritage sites in Italy. Satellite imagery and radar data can be helpful in finding cultural heritage sites, but the sheer volume of information that researchers have to sort through makes it nearly impossible for archaeologists to personally review and interpret each item.
By automating the analysis of archaeological remote sensing with AI, this project provides a valuable template for future projects. Rather than depending on subjective observation and time-consuming interpretation of an overwhelming amount of data, people can use machine learning to sort through information and dedicate their expertise to the most meaningful datasets.
Using LiDAR Applications in Mesa Verde
LiDAR, which stands for Light Detection and Ranging, functions by panning and pulsing laser beams and then measuring the bounceback of that light. This technology allows archaeologists to gather detailed information about large landscapes without disturbing the environment of sites. The information gathered with LiDAR can guide which areas of terrain archaeologists want to investigate first, as well as which areas may be challenging to access.
Right now, LiDAR is being used to survey the Mesa Verde region and uncover new knowledge about this landscape and the histories of the Indigenous peoples that have lived there. One way LiDAR has supported this project is by gathering more detailed information about where great kivas may have been located. Another thing that LiDAR has uncovered is the distance between locations and ancestral roads, which is helping researchers understand how different sites likely interacted with one another when they were in use.
By combining LiDAR surveys with GIS software, professionals can create simulations that combine all of the available data to reconstruct or predict the possible behavior of human systems in the past. These simulations allow archaeological researchers to consider several variables, such as weather patterns and population size, to see how groups may have adapted their use of the landscape and built structures.
Mapping a New View of Ancient Civilizations
GIS archaeology not only uncovers previously overlooked historical and cultural sites, but it can also offer new context to well-researched areas. Putting existing information into a new context can give professionals new insights into migration patterns and the reasons behind the settlement locations.
Xiangyang City, in the Hubei Province of China, has had people living there as far back as the Paleolithic period. While the topography has evolved significantly over time, archaeologists have still been able to locate several sites in the area that help us learn more about the people who once lived there.
Researchers are continuing to learn about the area and locate new archaeological sites. Some have employed a local relief model to create an archaeological site prediction map for the Neolithic Era. This map indicated that areas likely to have Neolithic Era archaeological sites were mainly around:
The Hanjiang River basin
The Tangbai River basin
Hinterlands of mountains and hills
Flat areas along rivers
Central downland plain areas
Eastern low mountains and hills
During the Neolithic Era, Xiangyang had many areas with lots of water and very fertile soil, which made for excellent farming conditions. These resource-rich areas were a considerable part of the appeal for people looking for a place to settle, so it makes sense that most of the Neolithic Era sites we’re aware of surround water sources.
After reviewing the LR predictions, researchers were then able to validate the model based on confirmed archaeological site locations, showing where the predictive model estimated sites would be aligned with the sites we have discovered so far.
About USC’s GIS Graduate Programs
The University of Southern California offers a comprehensive selection of online and residential GIS programs. This includes both GIS master’s degrees and GIS graduate certificates. Click on the programs below to learn about our leading geographic information science education.
Geospatial intelligence (GEOINT) is a broad field that encompasses the intersection of geospatial data with social, political, environmental and numerous other factors. The Intelligence Community defines geospatial intelligence as “the exploitation and analysis of imagery and geospatial information to describe, assess and visually depict physical features and geographically referenced activities on Earth.”
Geospatial intelligence (GEOINT) has played a pivotal role in military operations and in the broader context of human security for decades. From providing critical intelligence in resolving the Cuban Missile Crisis in 1962 to helping the U.S. facilitate the negotiations that ended the Bosnian War in 1992, GIS military applications have been crucial in ending conflicts that might have otherwise continued for decades longer.
One of the most fascinating aspects of GEOINT, however, is how it has evolved over time and taken advantage of new technologies. In addition to examining what geospatial intelligence is, we wanted to look at GEOINT through a modern lens and examine how governments and other organizations use GIS for GEOINT applications today, as well as some of the developments that have made helped GEOINT evolve, including:
The role of machine learning and GEOINT in disaster response
Interoperability for GEOINT applications and data in the military
The role of data stewardship in crisis mapping
Request Brochure
Fill out the information below to learn more about the University of Southern California’s GIS Graduate Programs and download a free brochure. If you have any additional questions, please call 213-325-2474 to speak to an enrollment specialist.
The Next Generation of GIS Intelligence Applications
One of the most significant trends in geospatial intelligence is the shift in creation and ownership of data. As the United States Geospatial Intelligence Foundation noted, new data sources like OpenStreetMap and geotagged social media pictures can be leveraged for vital intelligence. However, the availability and open nature of these platforms also presents challenges for the GEOINT community, which must rely on data it no longer has full ownership and control over.
1. Machine Learning and GEOINT: Managing the Chaos of Natural Disasters
While it may sometimes seem like the entire world is documented, catalogued and analyzed, there are still many permanent and semi-permanent structures that remain unmapped. One of the main barriers to collecting geospatial data has been the manual and time-intensive work involved; this is especially problematic for instances where landscapes and structures change dramatically (i.e. after a natural disaster).
Geospatial location intelligence software, augmented with machine learning and artificial intelligence (AI), could help to map changes in terrain and structures, making disaster response projects more efficient and more effective. Several organizations are looking toward algorithms to help create more timely and accurate maps. One example is the SpaceNet “Flood Detection Challenge,” a $50,000 competition to develop infrastructure and flood mapping capabilities. The goal is to reduce the impact of hurricanes and heavy rains that cause route obstructions and damage. Teams will combine existing datasets and algorithms from previous competitions with new data to address a disaster response scenario. These advancements aim to improve disaster response and recovery times while measuring the severity of the event.
2. Open Geospatial Data Platforms Helping Fight World Hunger
One of the core challenges in hunger worldwide is the fact that scarcity situations have usually already become dire by the time humanitarian efforts can begin. This is just one of the major challenges that DARPA is hoping to solve through a $7.2 million project awarded to Descartes Labs. The company hopes to create a vast geospatial data repository, leveraging sensors, satellite imagery and data from 75 different partners.
In 2017, the company hosted a hackathon, giving developers the goal of addressing food security issues. The resulting projects included:
A platform to help farmers share information that would help regions protect crop yields and prevent scarcity
The development of a food security risk index
A fish distribution system for optimizing delivery to regions affected by drought
Beyond the direct impact of reducing suffering from food shortages, the company suggests that addressing scarcity before it becomes a dire problem could help to avoid conflicts over resources.
3. Interoperability Drives the future of Joint GEOINT Operations
The U.S. military has been a long-standing user of GIS intelligence to resolve conflicts, protect troops, assess risks and gain information about enemy operations. While not a new trend, the military has addressed new challenges.
One of the most important shifts in the way the military uses geospatial intelligence was the adoption of the object-based production framework. This philosophy focuses GEOINT around assembling data together around specific issues, rather than tasking analysts with collecting information from many different sources. This way, analysts spend more time developing intelligence and insights rather than with data management.
This approach is especially valuable in multinational joint operations, where data and GIS applications must be interoperable to ensure all stakeholders have access to mission-critical information.
4. Geospatial Data Stewardship as a Critical Factor in Improving Crisis Mapping
Although the visualizations and analyses provided to emergency responders have drastically improved our ability to respond to events like hurricanes and other natural disasters, it is just one factor in how GEOINT has evolved. During the response to Hurricane Maria, for example, geospatial data was plentiful but disparate and difficult to use. This led to problems like duplicate deliveries and deliveries that were scheduled, but never made.
One of the developments to arise out of problems like these has been a rise in self-service geospatial intelligence products. For example, FEMA’s GeoPlatform Disasters Portal provides curated geospatial information and datasets from numerous other apps and sources, providing a key data stewardship role. This effectively gives first responders and GEOINT teams a running start in responding to natural disasters.
One of the core themes in all the above GEOINT uses is the vast volume of data. As we look toward the future, the ability to manage data at large volumes will continue to be a key theme. However, it’s important to note that the GEOINT industry will require expertise both in the analysis and in the preparation of that data. As the National Geospatial Intelligence Agency has indicated, managing and stewarding GEOINT data is critical to maintaining our national advantage in all applications of GEOINT.
About USC’s GIS Graduate Programs
The University of Southern California offers a comprehensive selection of online and residential GIS programs. This includes both GIS master’s degrees and GIS graduate certificates. Click on the programs below to learn about our leading geographic information science education.
Spatial data analysis is a robust field that has been key to many innovations and advancements in the technologies that we use in our day-to-day lives. Also known as geospatial analytics, spatial data analysis involves using modern information science and technology advancement to collect, analyze and interpret location-based data to gain actionable insights.
From ordering food online to identifying suitable locations to open a new business, to planning rescue routes and allocating resources before and after natural disasters, spatial data analysis plays an essential role in modern life.
Spatial data encompasses any data with a location-based component. Analysts apply this data across industries like urban planning, public health, transportation logistics and economics. By identifying patterns and trends, organizations and stakeholders can make informed decisions, optimize resources and reduce risks.
The complexity of spatial data analysis demands highly skilled professionals who have expertise in both geospatial information and modern computing technologies. With recent advancements in artificial intelligence, there is also a growing need for professionals who can apply machine learning methods to traditional spatial analysis in order to achieve more advanced pattern recognition and predictive modeling. Geospatial professionals must excel at acquiring relevant spatial data, conducting precise analyses and interpreting and visualizing their findings in clear, meaningful ways.
How Does Spatial Data Analysis Work?
Spatial data analysis involves examining data with a geospatial component, with a focus on the data’s geographic locations and attributes — such as climate, population density, housing prices or land use — and how they interact within a given area. Spatial data is inherently connected to geographic locations, meaning all such data relates to specific features or areas on the Earth’s surface. From there, spatial data is generally categorized into two types:
Vector data, which uses points, lines and polygons to represent discrete features like trees, roads and city boundaries.
Raster data, which consists of gridded cells, each with a specific value, ideal for representing continuous data on Earth’s surface such as elevation and temperature. Satellite and drone imagery are also considered as raster data.
On a broad level, spatial analysis gathers information from various sources, identifies how points correspond to spatial features, uncovers patterns and generates models and simulations. These visualizations transform raw information into practical formats, which in turn helps organizations make informed decisions.
Field mapping and historical records: Survey maps and historical maps provide spatial data on small and large scales.
Remote sensing imagery: Satellites, aircrafts and drones can provide comprehensive images with information of the Earth’s surface at various spatial, temporal and spectral resolutions.
GPS data: Global positioning systems (GPS) capture and transmit precise location information. Today’s Global Navigation Satellite System (GNSS) technology allows high-accuracy and large-coverage GPS tracking and monitoring. Modern GPS data can also be easily collected using mobile devices.
Surveys and census data: Detailed demographic and socioeconomic information can be used alongside geographical data to map patterns and relationships between people and their environments.
Spatial Data Analysis Tools and Software
After collecting data via the methods detailed above, spatial data professionals use analysis tools to perform their analysis. Some of the most common ones include:
GIS software: Geographic information systems (GIS) software like ArcGIS and QGIS enable analysts to identify spatial patterns, create maps to visualize spatial data and make informed decisions.
Statistical software: Software programs such as R Studio and Python are used for statistical computing, analysis and visualization of spatial data.
Visualization tools: Tools like Tableau and Mapbox model spatial data and communicate their findings with interactive maps and dashboards.
Spatial Data Analysis Techniques
Spatial data analysis uses a large variety of techniques to uncover patterns, relationships and predictions that inform decision-making. These methods range from overlaying datasets to creating predictive models, offering tools for professionals in fields like urban planning, healthcare and environmental management. Each approach provides a unique way to interpret data, solve problems and guide resource allocation.
Because there is such a wide range of techniques, we’ll provide just a few examples. To explore these methods further, we recommend resources from organizations such as Esri. Or you can go further with a Master of Science in Spatial Economics and Data Analysis.
Overlay Analysis Reveals Interactions Between Layers
Overlay analysis combines multiple datasets to highlight interactions. For example, you could overlay a map of flood-prone areas with population density data to identify communities at the highest risk of flooding. Emergency management agencies can then target these areas for prevention, such as improving drainage systems, or planning, such as developing an advance evacuation plan.
Buffer Analysis Assess the Areas Around Features
Buffer analysis creates zones around specific features to evaluate nearby areas. For example, local governments could use this technique to analyze how a new commercial center might affect traffic patterns, noise levels and property values in nearby neighborhoods. This information helps planners address community concerns and develop strategies to minimize negative impacts.
Hotspot Analysis Detects Clusters of Activity
Hotspot analysis identifies areas with significant high or low values. A utility company could use this to detect regions with unusually high energy consumption and then address these regions with efficiency programs or infrastructure upgrades. A retailer can use hotspot analytics to find areas with high foot traffic to determine the most promising locations for expansion.
Spatial Interpolation Estimates Missing Values
Spatial interpolation predicts unknown values using data from nearby locations. For example, it can estimate rainfall levels in areas without weather stations by analyzing data from surrounding monitored locations. Or, it could be used to predict soil quality for a specific plot of land based on measurements taken from neighboring fields.
Network Analysis Examines Connectivity and Flow
Network analysis evaluates how locations connect and interact. This technique can be used to optimize delivery routes or design more effective public transportation systems. It can also identify critical nodes — key points within a network that, if disrupted, would significantly impact the system. For example, in transportation planning, critical nodes might include major highways or central transit hubs essential for maintaining smooth traffic flow.
Geostatistical methods predict and analyze how variables are distributed across a region. Practical applications might include tracking groundwater contamination or identifying areas with valuable natural resources. These methods also help pinpoint regions of high variability or risk, such as areas prone to pollution or resource depletion. Government agencies or NGOs can then pursue more targeted interventions and sustainable resource management.
How Is Spatial Data Analysis Used Across Industries?
Industries across the board rely on spatial data analysis to make informed decisions using geographical information. Here are a few ways it is being utilized.
Transportation and Supply Chain Management
Supply chain professionals rely on insights into the movement of goods, people and vehicles to make sure that logistics operations run smoothly. Analyzing traffic patterns and road conditions, for instance, can help optimize routes and get goods to their destinations quicker, thereby reducing fuel consumption.
Spatial data enhances supply chain management by mapping the locations and workflows of suppliers, warehouses and distribution centers. With this information, companies can design more efficient supply chains, reduce transportation costs and improve inventory management.
Real Estate
Spatial data analysis allows developers, investors and policymakers to assess the geographic characteristics of properties and neighborhoods, such as proximity to amenities, transportation accessibility, potential impacts of natural disasters and crime rates. Using spatial analysis, real estate professionals can evaluate property values, investment potential and potential demand.
By evaluating property’s location, construction type and proximity to floodplain zone or wildlife-prone areas, real estate investors can identify vulnerable areas and mitigate potential environmental hazards, and insurance companies can set the insurance premium based on the risk assessment.
Planners can also use data such as traffic flow, housing and public services to pinpoint underserved neighborhoods or redevelopment opportunities that increase quality of life.
Environmental Management
In environmental management, spatial data analysis examines the complex relationships between natural resources and human activities. For instance, if a wetland is destroyed by pollution or development, spatial data analysts can be used to map the extent of damage, analyze environmental impacts and identify suitable areas for restoration. Spatial data analysis also helps monitor the use of natural resources, like water and minerals, so they’re extracted and distributed sustainably.
Public Health
Spatial data analysis can promote health equity by revealing areas with food insecurity, water contamination or air pollution, or limited access to medical care areas. This information paves the way for effective policy intervention, cleanup efforts, new clinics, expanded telehealth services and improved transportation options so individuals at the greatest risk of illness can get the care they need.
Disaster Management
When responding to a disaster, every second counts. Disaster management teams benefit greatly from spatial analysis of precise, real-time spatial data. Satellites, drones, remote sensors and other sources allow for immediate assessment of the impact of natural or human-caused disasters. Spatially-trained professionals can use this high-resolution, real-time data to route emergency response teams and distribute resources efficiently.
Spotlight On Spatial Economics
When spatial data analysis is applied to the economic sector, it is referred to as spatial economics. Spatial economics examines how factors such as location, distance and resource distribution affect economic activity on individual and social levels. It also aims to discover how geographic space itself is influenced by economic forces.
Using spatial data uncovers hidden patterns in economic activity and enables spatial economists to better understand the processes driving spillover effects, which are the indirect benefits or costs experienced by neighboring areas due to economic activities. For example, it can uncover how proximity to transportation networks influences property values, how the clustering of industries in certain regions drives economic growth or how geographic disparities in income and employment contribute to regional inequality.
Based on this data, policymakers and other professionals can more efficiently distribute resources and encourage equitable access to opportunities.
The Value of Advanced Education in Spatial Economics
Spatial economics is a complex field with an array of high-impact applications, which means well-trained professionals are in high demand. An advanced degree in this area, such as USC’s M.S. in Spatial Economics and Data Analysis, provides a targeted education in spatial data analysis and economics.
In USC’s master’s program, you’ll learn advanced statistical and econometric techniques, gain proficiency in data visualization and interpretation and enhance your ability to use geographic information systems (GIS) to analyze spatial economic data.
The program’s interdisciplinary approach combines the expertise of faculty from the Department of Economics and the Spatial Sciences Institute, providing students with a versatile education. Coursework in the program provides students with the skills and strategic thinking abilities they need to apply insights to highly specialized industries.
Graduates of the M.S. in Spatial Economics and Data Analysis will be prepared to solve complex problems related to emerging business opportunities, environmental trends, urban crime, congestion patterns, global security, real estate valuation, technology diffusion and other social and commercial issues.
About USC’s GIS Graduate Programs
The University of Southern California offers a comprehensive selection of online and residential GIS programs. This includes both GIS master’s degrees and GIS graduate certificates. Click on the programs below to learn about our leading geographic information science education.
Comments Off on How Remote Sensing Saves the Earth
Remotely gathering spatial information is a powerful means to understand and respond to urgent humanitarian and environmental problems. But, for many years, it was challenging to get the information required to take action as remote sensing data was limited and difficult to acquire. Now, with the combination of new data sources, faster analysis and products that deliver findings to key decision makers, it’s become practical to use remote sensing data and tools for a broad range of applications.
Nanosatellites are a key aspect of this advancement. The University of Southern California has had experience in developing and launching nanosatellites, including CAERUS, a component of the 2010 MAYFLOWER satellite, and an NVIDIA Jetson nanosatellite in collaboration with Lockheed Martin in 2020. Less expensive than traditional satellites, they can gather atmospheric data through radio occultation, a remote sensing technique for measurements like temperature and pressure. Dr. Thomas Yunck, founder of California-based GeoOptics, is leading the charge with his constellation of small satellites.
“We’re overturning a decades-long paradigm of having many government-owned assets in space and shifting to privately owned assets, where small companies are gathering, generating, and delivering data to governments. Over the next 10 to 15 years, everything about remote sensing is going to change,” Yunck said in 2019.
The University of Southern California created the online Graduate Certificate in Remote Sensing for Earth Observation in part due to these advancements in geospatial technology and remote sensing. Providing access to cutting-edge software, the 16-unit program prepares students to go from data to decisions: from data collection, to data processing, to data dissemination.
Remote sensing is valuable in many fields, such as in archaeology to detect ruins. However, in this article we’re focused on how spatial information aids us in protecting the planet and combating climate change. Below are several remote sensing applications to detect and address unwanted changes on the Earth:
Fill out the information below to learn more about the University of Southern California’s GIS Graduate Programs and download a free brochure. If you have any additional questions, please call 213-325-2474 to speak to an enrollment specialist.
Disaster Risk Management
As defined by the United Nations Office for Disaster Risk Reduction, disaster risk management and response aims to “prevent new disaster risk, reduce existing disaster risk and manage residual risk, contributing to the strengthening of resilience and reduction of disaster losses.”
Globally, extreme weather events are increasing, caused in major part by climate change. As we have become better at tracking these storms, the number of related deaths are decreasing, but there is still more to be done, and the importance of disaster risk management is not lost on officials. The Sendai Framework was established in 2015 at the Third UN World Conference on Disaster Risk Reduction in Sendai, Japan. Its purpose is to protect against current and new disaster risks by 2030 through seven components, including bringing down the number of people killed and number of people impacted by disasters, as well as improving “availability of and access to multi-hazard early warning systems.”
The International Charter: Space and Major Disasters, which began in November 2000, comprises 17 global members, including the United States Geological Survey (USGS) and National Oceanic and Atmospheric Administration (NOAA). Additional partners, like the company Planet, aid in the Charter’s mission by providing remotely sensed satellite data and delivering insights to consumers. Authorized users are able to activate the Charter, requesting the supply of data and support for major disasters. Since its founding, there have been over 730 global Charter activations, including recent activations for Hurricane Milton, flooding in Sudan and fires in Argentina.
In Europe, researchers at the Joint Research Centre (JRC) of the European Commission are working to lessen the impact of disasters and provide assistance when there is a crisis. The team relies on the use of the Global Human Settlement Layer (GHSL), a tool they’ve developed to analyze satellite imagery monitoring where people are living, along with their migration patterns. Understanding where people are located in relation to the path of natural disasters helps researchers predict how the population will be affected and do their best to reduce damages. After a natural disaster strikes, images of the devastation can be reviewed to decide where help is initially most needed.
There are many opportunities to bring together the fields of remote sensing and ecology. With the number of tools and level of accessibility, ecologist Nicholas Murray notes it’s a perfect time to use remotely sensed data for ecology research. NASA, the U.S. Geological Survey and the European Space Agency all offer free data for analysis, while commercial alternatives are also available. Murray recently utilized Google Earth Engine to view over 700,000 satellite images of intertidal zones over the years in under a week, a task he was able to complete much more quickly than when he previously had to rely on manual analysis.
In another recent study, ecologists used tools from the U.S. Oak Ridge National Laboratory DAAC to examine vegetation on the Andaman Islands. The researchers discovered that plant life deteriorated more rapidly in regions where elephants and spotted deer had been brought in.
There is a strong link between remote sensing systems and conservation planning. LiDAR (light detection and ranging) has aided in mapping coral reef structures and assessing the number and types of fish living there. Each housing around 4,000 varieties of fish, along with many other species, protecting coral reefs is extremely important for a number of reasons: They supply fisheries; provide a draw for tourism; and shield us from waves, storms and floods.
SmallSats have the potential to revolutionize ecology and conservation efforts. Traditional satellites have primarily been used in this field, but 1,400 nanosatellites were deployed as of January 2021, and there are many more launches planned. Less expensive than the traditional model, nanosatellites also offer high-resolution data that’s likely to be more accessible to ecologists and conservation biologists. What’s more, nanosatellites will make more frequent passes than traditional satellites do, allowing for continuous tracking.
Forest Firefighting Operations
Though wildfires can be classified as natural disasters, just 15 percent begin organically. Since it’s typically dangerous or impossible to collect data, remote sensing is crucial in firefighting efforts. NASA and the U.S. Forest Service use sensors on airplanes and drones to track fires and predict where the flames are headed next by considering variables like wind. Remote sensing data also allows researchers to monitor areas at a greater scale than they could on the ground.
The team at GeoAcuity, a geospatial consulting firm founded by USC adjunct associate professor Jason T. Knowles, were able to assist in California’s North Complex and CZU August Lightning Complex fires. Unmanned aerial systems collected data, allowing the team to process images and provide them to stakeholders within one hour of the flight.
Improving Quality of Life in Developing Countries
Remote sensing can be used to assist developing countries, including expanding electricity access. Earth observation is helpful in:
Assessing current utilities
Evaluating population density to determine needs
Planning grid infrastructure for minimal impact on the population, roads and geography
Another advantage is that open access remotely sensed data is typically less expensive than ground-based data. One example is remotely sensing “nighttime lights.” NASA’s open access Black Marble products allow researchers to filter out the moon and view artificial, human-created lights so they can view existing population centers and electric systems.
Land Cover
Remote sensing of the environment, including monitoring land cover — water, soil, vegetation, etc. — and how it has changed over time is important in tracking the effects humans have on the environment, along with natural shifts. Viewing this data can help managers decide on the areas most in need of preservation and protection.
One example is NASA Earth Observatory satellite images produced over time for Walker Lake in Nevada. Over the past 100 years, the lake has lost 90% of its volume because of “unsustainable irrigation practices coupled with extreme climate-change related droughts.” The Lahontan cutthroat trout is now unable to live there.
Satellite imagery cuts back on costs and the time it takes to collect this information compared to relying on ground-based data.
Ocean Resources
One use of remote sensing for oceans is to track changes in sea ice levels. The Greenland and Antarctic ice sheets are rapidly melting due to increasing air and ocean temperatures. According to data captured from NASA’s ICESat and ICESat-2, over 5,000 gigatons of ice melted from both areas between 2003 and 2019, causing sea levels to rise 14 millimeters. To help put the magnitude of just one gigaton into perspective, NPR notes that it is “enough to fill 400,000 Olympic-sized swimming pools.”
Scientists continue to monitor data from ICESat-2 to help determine a timeline for the liquefying ice and the impact it will have on coastlines worldwide. The shrinking ice also affects the planet in numerous other ways, including endangering wildlife like polar bears and snowy owls, releasing climate-warming methane and opening up additional water routes.
Remote sensing technology can also monitor ocean circulation and temperature. Created by Raytheon Intelligence & Space, the Visible Infrared Imaging Radiometer Suite (VIIRS) instrument on the Suomi NPP satellite provides ocean temperature readings on a daily basis. That knowledge can aid scientists in preparing for El Niño and La Niña climate patterns, as well as in combating the effects on marine life.
Soil Erosion
Soil erosion data from remote sensing can inform efforts to alleviate soil loss. Impacts of soil erosion include intensified flooding, along with increases in polluted waterways. The U.S. Department of Agriculture provides training on the use of remote sensing for soil surveys.
The National Cooperative Soil Survey (NCSS) pursues digital soil mapping to “facilitate the rapid inventory, re-inventory, and project-based management of lands in a changing environment.” Digital soil maps use raster layers, composed of pixels, rather than vector images, enabling soil scientists to develop more precise depictions of the land. Using machine learning models, collected geospatial data is sorted to aid in identifying spatial patterns.
GeoOptics will also contribute by launching about 50 new SmallSats known as CICERO-2, Community Initiative for Cellular Earth Remote Observation, from 2022-2027. The satellites will collect data on soil moisture and other environmental conditions for both government and commercial customers.
Data on soil composition is also important to farmers. Drones provide information on soil conditions so farmers can determine how to cultivate the land, allowing for a proactive approach to agriculture. Farmers can also take advantage of the data to determine what new crops would thrive and where on the land they should be planted.
Urban Growth Monitoring
Understanding how urbanization alters the environment, as well as identifying ways to lessen the impact, is an important area of study. It’s estimated that nearly 70% of the world will live in cities by 2050. Remote sensing tools can be used to monitor changing landscapes.
One study tracked the growth of Jeddah, Saudi Arabia from 1973-2014. It was found that, over the 41 year period, urban sprawl increased over 68 miles, influencing the land use but not majorly affecting land surface temperature.
Pollution is another concern for growing cities. Though they comprise less than two percent of the Earth’s surface, cities are responsible for the creation of over 70 percent of global CO2 emissions. Several cities in the United States, including Los Angeles, New Orleans, New York City and Pittsburgh, have committed to the use of renewable energy rather than fossil fuels. VIIRS, in addition to monitoring ocean temperature, can also be used to track air quality and calculate changes over time.
Targeting a Career in Remote Sensing
If you’re ready to help protect the planet by analyzing aircraft and satellite data, it’s time to explore remote sensing careers.
Remote sensing scientists and technologists may work for the military, government or in the private sector. Beyond data analysis and reporting on key insights, they are often tasked with developing new techniques and tools, like remote sensor systems and creating maps. According to labor analytics tool Lightcast, machine learning, Python and data science are among the skills that come with a salary premium for these positions. The top five locations with the most job postings for remote sensing scientists and technologists over the past 12 months include: California, Nevada, New Mexico, Idaho and Maryland.
A remote sensing certificate program will prepare you for leadership positions in the field, requiring less time and fewer credit hours than it would take to earn a remote sensing degree. You’ll gain the knowledge you need to leverage new data sources and methodologies to improve the efficiency and effectiveness of how you use remotely sensed imagery.
In the Graduate Certificate in Remote Sensing for Earth Observation at the University of Southern California’s Spatial Sciences Institute, you will not only learn the principles of remote sensing and earth observation, but you’ll also delve into non-conventional data sources like mobile devices, Twitter feeds and text-scraping. There are also opportunities to gain hands-on experience, including throughout the optional Catalina Island fieldwork excursion. During a recent trip to the island, students were able to design and execute a P4 drone flight plan around Fisherman’s Cove. They then processed the data collected and turned it into three-dimensional imagery.
About USC’s GIS Graduate Programs
The University of Southern California offers a comprehensive selection of online and residential GIS programs. This includes both GIS master’s degrees and GIS graduate certificates. Click on the programs below to learn about our leading geographic information science education.
Geographic Information Science (GIS) offers powerful tools for performing detailed analysis of spatial data and solving complex problems. Traditional GIS data is based on mapping in two dimensions, an x and y-value, which can be limiting in some applications. Utilizing 3D GIS software lets users engage with data from a whole new perspective that results in more nuanced insights and detailed visualizations.
What is 3D GIS?
3D GIS brings enhanced depth into data collection and analysis by incorporating a z-value into mapping. Most commonly, that means including elevation data, but users have many options for adding layers of information.
For instance, a map might include a dimension based on the concentrations of certain chemicals and minerals or which parcels of land are best suited for development. Working with three dimensions, GIS professionals can often apply their findings to address real-world issues with greater accuracy.
While 3D models are more difficult to create and maintain than 2D ones, there are myriad 3D GIS applications where this technology is greatly beneficial. These four examples demonstrate how an investment in 3D GIS modeling can generate added value:
Request Brochure
Fill out the information below to learn more about the University of Southern California’s GIS Graduate Programs and download a free brochure. If you have any additional questions, please call 213-325-2474 to speak to an enrollment specialist.
1. City Planning
Cities have a way of growing to encompass previously under- or undeveloped areas in a process often called urbanization or urban sprawl. There are many reasons behind urban sprawl, including a desire to build improved infrastructure, affordable land or tax rates, or overcrowding inside the city. Urban sprawl can have a major impact on people who decide to leave the city as well as those who remain. For example, as residents move farther away from the city center, infrastructure such as roads or public transportation systems must accommodate their commutes, and traffic can lead to higher rates of air pollution.
To minimize the negative impacts of urban sprawl and increased development, it is important for city planners to carefully determine the best way to grow urban areas. Urban development needs to take into consideration today’s requirements, potential changes in demand and the long-term effects of building upward and outward.
3D GIS software can help city planners visualize what their proposed changes will look like and predict the outcomes for current residents and future generations.
In one example, the Queensland Cross River Rail project team used a digital twin to help plan and design the city’s first subway. Using 3D GIS data, they created a model of the subway and the capital above it. This model served as a central repository, housing all data related to new stations and tunnels.
The model was then integrated with the Unreal game engine, which allowed engineers and other decision makers to explore the project using virtual reality. In addition, the team could quickly experiment with placement of aspects like public art installations.
2. Building Information Modeling
Building information modeling (BIM) is a technology that generates digital representations of facilities and relevant processes. BIM has given facilities managers the ability to closely review structures, beginning with the construction planning phase.
Used in conjunction with 3D GIS data, BIM can help create robust building management plans and allow for more detailed analysis. For example, before breaking ground on a construction project, stakeholders can review findings from GIS and BIM to draw conclusions about environmental impact, sustainability, disaster readiness and how to optimize the use of assets and space.
In one project, the Connecticut Department of Transportation determined that a bridge constructed in 1896 had exceeded its lifespan and would require replacement. Early in the project, the contractor working on the new bridge identified the need to connect geospatial data with BIM data. This data integration both simplified the team’s design process and allowed them to monitor live sensor input from the existing bridge throughout construction. The team soon realized that this blended data could also inform the maintenance and operation of the new bridge.
3. Coastal Modeling and Analysis
A nation’s coastline is a crucial gateway for imports and exports, and about 40 percent of the world’s population lives within 60 miles of a coast. But these areas also pose numerous challenges for development.
Its critical for planners to understand the factors that affect construction and maintenance for shipping ports, fisheries, mineral mining operations and wilderness preservation areas. Responsible coastal development must be informed by underwater topography, local vegetation and predictions for the long-term environmental impact.
Resource planning systems that draw on GIS can provide insights into the economic, environmental and cultural results of activities along the coast. The right data makes all the difference in sustainably performing operations like construction or excavation. When preparing for the extraction of resources on the coastline, organizations benefit from synthesizing information like:
Findings from 3D GIS mapping that suggest the likely outcomes of dredging material in the water
Lidar topographical surveys
Data sets from past extraction activities
Trends in coastal change
4. Wind Farm Assessment
Planning a wind farm requires a detailed analysis of an environment and the potential effects of the structures. By using 3D GIS modeling, planners and other stakeholders can get a better idea of the impact from wind farm development on wildlife and people.
For example, when assessing possible wind farm locations in two dimensions, a bird’s migratory path might make a location seem inaccessible. However, reviewing that same space using 3D GIS data, may reveal that the elevation of birds’ flight paths and the height of the wind farm are compatible.
In Switzerland, developers wanted to find a way to accurately determine the noise that would be generated from the installation of a new wind farm. A team developing a visual-acoustic simulation tool decided to study Mont Crosin in the Canton of Bern, Switzerland, which is home to 16 wind turbines. The researchers analyzed recordings taken on days with varying wind and weather conditions and wind speed measurements taken with a 3D ultrasonic anemometer. They generated information models representing vegetation, infrastructure and the wind turbines themselves. The 3D data allowed planners to predict the noise and environmental impact that would be produced by the proposed wind farm.
About USC’s GIS Graduate Programs
The University of Southern California offers a comprehensive selection of online and residential GIS programs. This includes both GIS master’s degrees and GIS graduate certificates. Click on the programs below to learn about our leading geographic information science education.
Comments Off on GIS Applications in Climate Change: How GIS Transforms Our Climate Response
Developments in geographic information science (GIS) have transformed how researchers in a variety of fields gather and analyze information about the world around us. Scientists gain valuable insights in areas such as geology and meteorology by gathering remote sensed data and implementing geospatial tools. The perspective offered by GIS technology and methods can be particularly important in studying global climate change.
According to NASA, the Earth’s average surface temperature has increased by approximately 1.62 degrees Fahrenheit since the late 19th century. Scientists attribute problems like extreme weather events, rising sea levels and diminished ice sheets and glaciers to the emission of carbon dioxide and other greenhouse gases into the atmosphere. The Fourth National Climate Assessment, released by the U.S. Global Change Research Program in November 2023, predicted long-term consequences such as:
Worsening air quality
More frequent and severe extreme weather events
A decline in crop production
Greater incidence of food and waterborne diseases
An increase in heat-related deaths in the U.S.
Diminished populations of underwater creatures due to ocean acidification
There are a multitude of GIS applications in climate change. Using GIS techniques and software, experts can closely monitor these dangers. Robust geospatial data and detailed visualizations offer guidance for organizations and government agencies as they plan for the challenges ahead. By bringing together GIS and climate change studies, spatial problem-solvers can seize opportunities to make a difference in the lives of future generations.
Request Brochure
Fill out the information below to learn more about the University of Southern California’s GIS Graduate Programs and download a free brochure. If you have any additional questions, please call 213-325-2474 to speak to an enrollment specialist.
How GIS is Used in Climate Change Research
Climate scientists gather vast amounts of data to track environmental problems and investigate the causes. Spatial reasoning is crucial for analyzing and synthesizing findings from sources such as remote sensors and satellite imagery. Researchers draw on geographic information systems to reveal how the planet has changed through the years, predict the transformations that are yet to come, and communicate what they learn to policymakers and the public.
Continuing advances in GIS technology have established mapping as a crucial means of identifying connections between the state of the climate and other areas of concern. Open-source databases allow for unprecedented collections of spatial information, and high-speed data processing reveals changing conditions in real time.
Some of the ways that researchers are using GIS for information on climate change include:
Locating areas where temperatures are particularly high or especially erratic in comparison with the global average
Discovering how natural atmospheric processes might affect global warming
Creating models to show how a warming climate might impact the ecology of various regions
Examining the relevance of shifts in land cover, such as the removal of trees, to climate change
Visualizing multiple factors with the potential to affect crop growth, industry, wildlife and much more
Geospatial tools offer perspective on evolving weather patterns, rising sea levels and growing risks to human health. Informative visualizations show these developments in ways that scientists and non-experts alike can understand. In turn, local governments, nonprofits and other organizations apply what they learn from geographic models to set strategy and make informed decisions.
GIS in Climate Change Disaster Response: Responding to Extreme Weather
Scientists have linked the warming climate to extreme weather like floods, droughts, heat waves and hurricanes. Evidence suggests that increasing global temperatures may make these events more frequent and severe. Geospatial methods improve our understanding of how climate change affects weather patterns and can warn communities of dangers to infrastructure, residents and property.
For example, a study from the Pennsylvania Department of Transportation set out to examine the state’s history of flooding, construct a framework to account for the climate’s impact on future storms and predict problems that might occur due to extreme weather. Researchers used GIS to analyze relevant information such as historical precipitation data and risk assessment scores for roads and bridges and generate visualizations.
When extreme weather does strike, geospatial intelligence provides support for first responders and recovery workers. Hazard maps based on remote sensing data and satellite imagery keep government officials informed about current conditions and what areas have the greatest need of urgent attention. Response teams provide updates and photos from the ground, leading to efficient and effective crisis management. After a major storm or fire is under control, geographic information guides utility companies as they restore service and assists in the planning processes for replanting crops or rebuilding structures.
Guiding Renewable Energy Strategies: GIS Applications in Climate Change Mitigation
To address climate change, many local governments, nonprofit organizations and businesses have committed to reducing their dependence on fossil fuels. Establishing sustainable systems that put alternative energy sources to work depends on robust data and close monitoring. That is why many organizations employ GIS to solve the spatial problems involved in minimizing their carbon footprints.
Some applications for geospatial tools and analysis in harnessing green energy are:
Creating visualizations to show how people and businesses are using power
Gaining visibility into a region’s available natural resources
Noting the best locations for raising crops that yield biomass to be used as fuel
Evaluating whether a building receives sufficient sunlight to be a good choice for solar panel installation
About USC’s GIS Graduate Programs
The University of Southern California offers a comprehensive selection of online and residential GIS programs. This includes both GIS master’s degrees and GIS graduate certificates. Click on the programs below to learn about our leading geographic information science education.
Comments Off on Leading International Security Threats
As increased globalization and advancements in technology raise the stakes in international relations, concerns that were once local now have the power to destabilize regions and make global impacts. Where global security efforts were once focused almost exclusively on borders and conflict, the pervasiveness of environmental and humanitarian concerns have become important focuses for government officials and security professionals. Ensuring global security contributes to international stability and peaceful coexistence among nations.
We spoke to two faculty members from the Spatial Sciences Institute at the University of Southern California — Steven L. Lamy, professor emeritus of political science and international relations and spatial sciences, and Diana Ter-Ghazaryan, associate professor (teaching) of spatial sciences — to gain their expert opinions on the biggest threats to international security and to learn how USC prepares students to help address security issues.
Climate Change
With global temperatures rising to historic levels on an annual basis, climate instability and its effects are already causing severe problems around the globe. Developed nations, such as the United States, are not immune to the problems caused by climate change: the sea level in California is projected to rise up to 55 inches by the end of the century, which will increase saltwater contamination in the Sacramento/San Joaquin Delta and threaten both wildlife and the drinking water of 20 million California residents.
However, the poorest and least developed nations, despite generally being low-emitters, are the most likely to experience the effects of climate change. Vulnerable populations in these countries are far more likely to experience disease, displacement and childhood and maternal mortality. These threats are not new to these populations, but climate change exacerbates their severity.
“Climate change is the most important international security threat of our time — it is an existential threat. It is leading to an increase in the number and intensity of natural hazards, which are affecting populations across the world and leading to mass displacement in certain geographic areas, many of which are already vulnerable to other international security threats such as health insecurity and hunger/malnutrition.”
— Diana Ter-Ghazaryan, Associate Professor (Teaching) of Spatial Sciences
High Intensity Conflict and Instability
The world recently reached the worrying threshold of having more active conflicts at once than at any time since the end of World War II. Russia’s invasion of Ukraine and the continuing war poses a particularly major risk. As Professor Lamy notes, “there is a chance of that war escalating to a nuclear confrontation or a war with high intensity weapons.”
Mass Displacement of Populations
While climate change and economic conditions are also major factors that contribute to displacement, armed conflict has certainly contributed to the staggering 120 million forcibly displaced people in the world. 73% of these refugees have been displaced from Afghanistan, Venezuela, Syria, Ukraine and Sudan, all of which have experienced war in the last 5 years (with the exception of Venezuela).
Artificial Intelligence
While the use of AI is leading to new efficiencies in many different industries, the rapid adoption — and reliance on — the new technology is raising concerns for international security specialists. Apart from the more common concerns of AI providing false information and it being used to accomplish sophisticated cyber attacks, AI may pose a greater existential threat.
In defense and warfare, AI has the potential to completely transform the way that we handle geopolitical conflict and war. Experts anticipate that military entities will primarily leverage AI for strategy and tactics, as well as in the creation and operation of automated weapons. While this technology could improve target prioritization (thereby making war less lethal), strengthen deterrence and assist in decision-making, this technology poses great risks unless regulations are put in place. For example, we are already seeing AI being used in automated weapons and drone strikes. In order for this technology to be used ethically, defense departments must ensure that automated targeting systems will not harm civilians.
Hunger and Malnutrition
The Global Report of Food Crises reported that, in 2023, nearly 282 million people in 59 countries and territories experienced “high levels of acute food insecurity requiring urgent food and livelihood assistance.” In Palestine, South Sudan, Burkina Faso, Somalia and Mali, hunger is expected to reach catastrophic levels, leading to starvation, death and critical malnutrition.
The global food crisis is driven by a multitude of compounding conditions, with primary factors being conflict, climate change, and economic circumstances. 70% of the people suffering from hunger live in areas that are being impacted by war, conflict and violence. As for climate change, agriculture and animal husbandry are impacted by even the slightest changes in climate and weather — except the changes can no longer be considered minor. For example, 95% of Africa’s farmers rely on rainfall due to lack of irrigation systems, and, rainfall is increasing on the continent by 30% in wet regions and decreasing by 20% in dry regions. Due to the lack of rain (or the excess of rain), agricultural productivity has declined by 34%.
Transnational Organized Crime
Criminal networks attempting to gain money, power and influence across international borders are currently working in three major categories: human trafficking, drug trafficking, and money laundering.
Human Trafficking
As of January 2023, there were an estimated 26.7 million victims of trafficking worldwide. These victims are all ages and genders, and are forced or coerced into labor, entertainment or sexual exploitation for profit.
Drug Trafficking
The cultivation, processing, shipment and sale of illicit drugs such as cocaine, heroin and fentanyl presents major threats, including violence, addiction and deaths due to overdose.
Money Laundering
Money laundering is the process of “concealing or disguising the origins of illegally obtained proceeds so that they appear to have originated from legitimate sources.” Money laundering has become an increasingly serious problem, as technological advancements such as cryptocurrency have made it easier for criminals and criminal organizations to conceal their activities. Money laundering has a major economic impact, approximately $1.87 trillion is laundered globally every year, but perhaps the larger cost is that laundered money often funds the further growth of transnational crime, such as trafficking rings.
Failed and Fragile States
The intentional destabilization of failed and fragile states has been a problem for a very long time. Echoing the scramble for Africa in the late 1800s and early 1900s, we are seeing large, wealthy, highly developed countries throughout the world take advantage of smaller, less developed countries as a way of gaining their natural resources.
Professor Lamy notes that this phenomenon is most prevalent in Africa, where “the great powers are competing for influence and rare earth minerals.” More specifically, the Wagner Group, a Russian state-funded private military organization with a deeply problematic past, has been used to destabilize fragile or failed states in order to secure their resources.
States often become fragile or failed as a result of war and conflict. As Professor Lamy says, “wars in Libya, Sudan, Somalia and along the coup belt are devastating populations and challenging global stability.”
Being Part of the Solutions
It is clear that these threats are deeply interconnected. As noted by Professor Lamy, “Climate is existential and a driver of instability because it can be the source of hunger, poverty and scarcity that drives conflict.” Our world needs security specialists who understand the big picture of how all of these threats compound upon each other to affect individuals, nations and humanity. An effective way to advance your career in this field is with a master’s in global security studies from a program such as the one offered by USC’s Spatial Sciences Institute.
“In our global security studies program, we consider national security concerns, environmental security, and human security, or freedom from fear and want.”
— Steven L. Lamy, Professor Emeritus of Political Science and International Relations and Spatial Sciences
USC’s M.A. in Global Security Studies (M.A. GSEC) program examines intersecting issues challenges. As a student in the program, you will learn to develop policy-based solutions throughcase studies in spatial sciences, political science, international relations and economics. Our graduates are equipped with a thorough understanding of changing world dynamics and the tools to make a difference.
One of the core disciplines of the program is spatial sciences, which Professor Lamy describes as being “a tool that allows us to see the landscape of a problem.” He went on to explain that “when studying global poverty and migration of populations away from natural disasters, spatial sciences help us develop a full picture of the landscape of human suffering.”
Spatial sciences and geographic information systems are key to the future of global security. These technologies are being used to combat the effects of climate change in a variety of ways, optimizing placement of renewable energy installations, tracking sustainability efforts, fortifying systems against cyberattacks and identifying areas most prone to weather disasters.
Graduates of the M.A. in GSEC program are currently working on several major international security issues, addressing nuclear weapons issues in Washington, working with consulting firms to assess how security concerns influence investment policy, aiding in the design of missile defense programs and helping coordinate responses after natural disasters.
About USC’s GIS Graduate Programs
The University of Southern California offers a comprehensive selection of online and residential GIS programs. This includes both GIS master’s degrees and GIS graduate certificates. Click on the programs below to learn about our leading geographic information science education.
Fill out the information below to learn more about the University of Southern California’s GIS Graduate Programs and download a free brochure. If you have any additional questions, please call 213-325-2474 to speak to an enrollment specialist.
Organizations rely on geographic information science (GIS) for applications ranging from navigation in autonomous vehicles to mobile games played in real-world spaces. GIS specialists reveal valuable insights by employing best practices of spatial data collection, analysis and visualization. Their discoveries fuel problem solving and strategic decision making in organizations such as scientific and technical services firms, government agencies, humanitarian nonprofits and the military.
As GIS techniques continue to evolve, users can leverage spatial data to deepen our understanding of patterns and relationships in the world around us. To make the most of this potential, professionals must hone their capacity for spatial thinking and GIS technical skills. If you are interested in pursuing a career at the forefront of geospatial thinking, exploring the GIS skills that are most needed in today’s organizations could be a vital step.
What Skills Are Important for Roles in GIS?
Succeeding as a spatial problem solver starts with acquiring a toolkit of fundamental GIS competencies. Roles in this field call for a combination of creative thinking and technical knowledge, which means becoming highly familiar with an array of essential platforms, tools and methods. Common roles in the GIS field include:
GIS Analysts
GIS Technicians
GIS Specialists
GIS practitioners are responsible for compiling accurate information, creating detailed maps and performing in-depth analyses. By learning approaches to data processing and cartographic design, they can offer new perspectives on the physical processes and social interactions that take place on the earth’s surface. A theoretical understanding of geographic relationships enables experts to spot noteworthy connections in the data and draw meaningful conclusions.
Request Brochure
Fill out the information below to learn more about the University of Southern California’s GIS Graduate Programs and download a free brochure. If you have any additional questions, please call 213-325-2474 to speak to an enrollment specialist.
Proprietary platforms like ArcGIS as well as open source platforms are capable of synthesizing relevant information from physical maps, global positioning systems, geocoding and a variety of remote sensing systems. Skilled users can layer the resulting digital maps with a vast range of scientific and economic data. In turn, these capabilities can be harnessed for goals like showing urban planners unmet needs for housing or transportation and informing policymakers about the effects of climate change.
That’s why it’s crucial for professionals to convey their discoveries through clear and compelling visualizations. Mapping software has become more versatile and easier to use over the years while advances make it possible to represent spaces with unprecedented levels of detail. 3D GIS offers an additional dimension of complexity so users can represent elevation, depth or other variables.
In-Demand Skills for Roles in GIS
According to the U.S. Department of Labor and Lightcast, the following skills help GIS professionals stand apart when applying for the positions of GIS Analyst, GIS Technician or GIS Specialist.
The following skill set is not exclusive to the Geographic Information Systems field and can be developed across a wide variety of educational and professional backgrounds.
Python
Python is an interpreted, high-level, general-purpose programming language. Thanks to its rich ecosystem of libraries such as ArcPy, GDAL and GeoPandas, Python is used extensively in Geographic Information Systems (GIS) to automate tasks, perform spatial analysis, manipulate and analyze geospatial data and build mapping applications.
Data Analysis & Data Visualization
Data Analysis & Visualization enables professionals to interpret complex geospatial data sets and uncover patterns, trends and relationships within them. These processes help turn geospatial data into clear graphic representations with multiple layers of useful findings.
SQL
SQL (Structured Query Language) is a standard programming language specifically designed for managing and manipulating relational databases. In GIS roles, SQL is crucial for querying, updating and managing spatial databases, allowing users to efficiently retrieve and analyze geospatial data stored in a relational database system and then integrate this data with GIS software for spatial analysis and mapping applications.
Computer Science
Computer science plays a pivotal role in Geographic Information Systems (GIS) by providing the foundational technologies and algorithms for processing, analyzing and visualizing spatial data.
GIS Skills for Industry Professionals
Professionals who strengthen their GIS skills may excel as GIS analysts, technicians, project managers or developers. Completing a master’s or graduate certificate in Geographic Information Science and Technology (GIST) can prepare you to lead the next generation of innovative projects.
Geographic Information Systems
GIS as a skill involves using geospatial concepts, data analysis techniques and mapping principles to solve complex spatial problems.
ArcGis & GIS Applications
Expertise in industry-leading software like ArcGIS by Esri is crucial when building a career in the GIS field. Learning ArcGIS equips GIS professionals with a versatile and powerful toolkit, enabling them to execute their tasks with greater efficiency and innovation. Using these tools can enhance the value and effectiveness of GIS professionals in a wide range of contexts.
Data Analysis
Spatial analysis is a foundational skill in GIS that is similar to data analysis. However, it is primarily concerned with geographic data, which has inherent spatial attributes such as location, distance, area, shape and relationship to other spatial objects.
Spatial Analysis
The management of robust spatial data infrastructures that support the collection, storage, analysis and dissemination of geographic information is a crucial skill for GIS professionals.
What Skills Are Required for GIS Analysts?
What Is a GIS Analyst? GIS Analysts are professionals skilled in using GIS technology to analyze spatial and geographic data. As GIS goes to work in an expanding variety of fields, GIS Analysts need to be prepared to adapt to the unique requirements of different types of geographic analyses.
GIS Analysts may be responsible for tasks such as:
Creating maps
Database management and administration
Using geographic data for spatial analysis
Automating processes with programming languages
Remote sensing interpretation
Manage data collected by surveyors
According to labor analytics provider Lightcast, when hiring for GIS Analysts, companies prefer to hire candidates with the following skills:
Project Management: GIS analysts are expected to have skills in project management and should be familiar with Agile methodologies, Scrum methodologies and workflow management.
Computer Science: GIS analysts should have experience with solutions architecture and software development in order to successfully fulfill job expectations.
Programming Languages: Python and SQL are critical to the day-to-day work of a GIS analyst.
When applying for a Geographic Information Systems analyst role, professionals can further differentiate themselves with skills or experience in cybersecurity, DevOps or the systems development life cycle.
GIS Leadership Skills
A broad understanding of management principles and effective communication is often a major advantage in a GIS career. When experts perceive how spatial data contributes to achieving larger objectives for an organization or industry, they can manage projects efficiently and convey strategically relevant information to decision-makers. Professionals who integrate analytical thinking with organizational knowhow become effective leaders for technical teams.
GIS project managers need to see the big picture, selecting and executing the most appropriate methods for data sourcing, evaluation and management. For example, the technical choices that go into maintaining relational databases affect whether key insights can be easily highlighted and shared across multiple departments in an organization.
Once those requirements are established, a leader must be able to set and enforce expectations for team members. Resources such as project management tools and open source software can help team members work together and meet deadlines. By communicating with executive leadership, project managers can demonstrate why spatial information is important and ensure that analysts and technicians have the support they need to do exceptional work.
About USC’s GIS Graduate Programs
The University of Southern California offers a comprehensive selection of online and residential GIS programs. This includes both GIS master’s degrees and GIS graduate certificates. Click on the programs below to learn about our leading geographic information science education.
Comments Off on 4 Reasons To Pursue a Career in GIS
It is a great time for geographic information systems (GIS) careers. Geographic tools are more accessible and more powerful than ever. Cloud-based applications allow users to work nearly anywhere, while crowd-sourced information has fueled a massive global dataset. Drones can create nearly instantaneous maps, while LiDAR sensors are building remarkable 3D worlds in real-time.
If these advancements excite you and you are intrigued by how geospatial approaches can change your industry, a career in the dynamic, ever-evolving field of geospatial sciences may be a great option for you. Here are four reasons why GIS careers may be some of the best ones out there.
Given the many ways we use GIS technology to solve problems, it’s no surprise that job research site Zippia projects the demand for GIS analysts, technicians and similar jobs will increase 9% through 2028.
That demand is translating to higher GIS salaries: median salaries are at their highest point in years for jobs that ask for geographic information system skills, according to the labor database Lightcast.
Median Salary for GIS Jobs* and Number of Job Postings
Advertised salaries for jobs in the GIS field have risen by over 23.7% since March 2021.
Professionals with GIS training are employed in a wide variety of roles. Median salaries range from $47,174 to $164,070, with pay varying based on position and experience level. Some of the highest paying GIS jobs are at the managerial level. Here is how much some of these roles pay on average based on job title:
At USC, many students report above-average salaries, with 55% of graduates employed at $75,000 or higher, as reported in USC GIST’s 2020 Student Outcome Survey.
In addition, 57% of graduates report a pay increase after graduating from USC, making a master’s in geographic information science and technology a worthwhile investment. For more information on GIS as a career, plus outcomes and opportunities, visit USC’s GIS Careers page.
#2: Join a Growing Field
The GIS market is projected to reach $134.23 billion by 2030, according to an Emergen Research report. This translates to a positive job outlook for the GIS field – total demand for roles requiring geographic information skills have increased by 98% from 2021 to 2023, according to Lightcast.
Why Are GIS Jobs in Demand?
Different sources point to different reasons for this growth, but some commonalities include: increased government funding for GIS projects; the need for maps that can guide urban planning; a telecommunications sector moving to 5G; and the accelerated adoption of AI and machine learning.
An example of this investment is the Bipartisan Infrastructure Law signed in 2022. Among the $1 trillion in funding is money for projects like universal broadband and autonomous vehicles, both of which require advanced geospatial technology as well as advanced management and planning skills. (Fittingly, the public can track funds from the bill via a GIS-supported dashboard.)
Mapping Is Key to Future GIS Job Growth
The World Bank estimates that the global urban population will double in size by 2050, with almost 70% of all people living in cities. Urban areas need to ensure tenable growth that maintains a decent quality of life to its new and existing inhabitants. This is fueling a need for those who can visualize the rapid population changes and implement geographic data-driven solutions that improve the efficiency, sustainability and livability of cities.
Maps built from geospatial data can help urban planners track land-use patterns over time. They can predict how their decisions might impact the growth and development of a city. When policymakers weigh the approval of new developments in their district, their decisions can be influenced by maps that show access to transportation, proximity to amenities and services, and any detrimental health factors.
Telecommunications Is Improving GIS Capabilities — and Vice Versa
A United Nations report on geospatial trends lists connectivity as the “most critical enabler of digital transformation over the next 10 years.” That report also notes that advances in next-gen mobile technology will revolutionize the way data moves.
That same UN report points to the rollout of 5G as a game changer for emerging GIS technologies propelled by the arrival of ultra-fast speeds and what it calls “ubiquitous connectivity.” But they note that the biggest impediment is the speed of deployment. In order to improve efficiency and deal with 5G’s more easily blocked signals, telecom companies are using spatial analysis to create precise visualizations of an optimal network.
GIS Professionals Must Be Ready for AI and Machine Learning
Artificial intelligence and machine learning tools are becoming more than helpful — they are becoming necessary. The amount of data available to us is staggering; Cisco estimates that the Internet of Things alone produces 5 quintillion data bytes a day. By automating some routine tasks, GIS professionals can focus on tasks that require more creativity and critical thinking.
Combine AI and machine learning tools with open-source GIS mapping software and cloud-based applications, and GIS professionals across industries can create sophisticated visualizations without limits from technology availability or capability. These add up to incredible opportunities for those who understand how to harness these possibilities.
As artificial intelligence and machine learning become more accessible to industries beyond the sciences, there will be a need for specialists who can navigate these applications and make use of the results. While automation might eliminate some roles that deal with more rote responsibilities, it will open up more positions and career growth for those who have enhanced skill sets.
#3: Flexible Opportunities to Match Your Goals
GIS jobs make for great careers, but there is not a singular path for those with geospatial skills. Graduates of GIS programs are not limited to one industry or location. You can find a position that fits your ideal working life and that follows the ways you want to impact the world.
GIS careers can accommodate both those who like the structured setting of an office and others who prefer the outdoors.
For those who want to work from home or from a different state than their organization, many GIS jobs are fully remote.
The public, private and nonprofit sectors all employ GIS professions.
GIS specialists are also in demand across industries — agriculture, emergency management, environmental services, finance, health care, forestry, real estate, retail, transportation, sustainable energy, telecommunications and so many more.
GIS Careers: Work Across Industries
GIS has a long history in urban planning, environmental sciences and defense, but its use has grown to include numerous other fields and subfields. Here are some examples of unique applications of GIS technology in a variety of industries:
Climate: Extreme weather events are increasing in number and severity. GIS technology helps officials respond quickly by making it easier to collect and share data so that responders can minimize damage and mitigate future problems.
Public health: We’ve seen GIS in action tracking the COVID-19 virus, but scientists, doctors and public officials have used geographic data to track health concerns, from disease spread to drug crises, since the nineteenth century.
Gaming: “Pokémon Go” famously incorporated GIS technology into a gaming experience unlike any other of the time, and 80 million monthly users still navigate the mixed-reality world. Some even argue that video games themselves can be considered a kind of GIS.
Real estate: Sellers and buyers alike use GIS to support their real estate decisions. Firms like CBRE Group incorporate GIS data into their property appraisal and portfolio management, while homebuyers can take virtual 3D tours and find out the “walk score” of a property in a few clicks.
Nonprofits: Often operating with narrow margins, nonprofits need reliable ways of identifying need, improving resource allocation, tracking donor relationships and charting the progress of campaigns. GIS can help with each of these initiatives.
#4: Make a Difference
With GIS technology capable of processing and analyzing increasingly complex data sets, societies can address challenging problems of both small and large scales more effectively. The geographic data collected today provides a comprehensive perspective and shines light on solutions.
Consider an issue that plagued essential workers during the COVID-19 pandemic: childcare. Many families struggled to find alternative solutions when schools went remote. To help caregivers, the state used GIS technology to create an online, interactive dashboard that showed open childcare facilities within a school district. A team built the map based on geographic data provided by the Office of the Superintendent of Public Instruction. They included important details from the State Emergency Operations Center such as facility addresses, hours of operation, contact information and alternative sites.
GIS also helps organizations that provide services to individuals experiencing homelessness. Every year in January, cities across the country conduct a count of all shelters and unhoused people in their area. Called the point-in-time (PIT) count, the Department of Housing and Urban Development requires this count in order to receive federal funds. In 2022, the City of Frederick, Maryland, switched from pen and paper to ArcGIS.
The change allowed them to process surveys in real time and later create visualizations accessible to volunteers, donors and community members. This more accurate, time-saving count meant that organizations could more effectively deploy resources and that staff could focus more on providing needed services.
About USC’s GIS Graduate Programs
The University of Southern California offers a comprehensive selection of online and residential GIS programs. This includes both GIS master’s degrees and GIS graduate certificates. Click on the programs below to learn about our leading geographic information science education.
Fill out the information below to learn more about the University of Southern California’s GIS Graduate Programs and download a free brochure. If you have any additional questions, please call 213-325-2474 to speak to an enrollment specialist.
Comments Off on Why GIS Is Important in Urban Planning
Cities are systems of tremendous, ever-evolving complexity. Responsibly guiding an area’s development requires spatial information that’s robust, nuanced and constantly updated, as well as the problem-solving skills to apply that information. This challenge has made geographic information science and technology (GIST) invaluable to urban planners.
Spatial data points the way to improving quality of life and building sustainable communities, while geographic information science (GIS) professionals use spatial thinking to transform that data into actionable insight and solutions.
What Is The Role of GIS in Urban Planning?
One of the reasons why GIS is important in urban planning is the ability to better understand current needs for a city and design to fulfill those needs. By processing geospatial data from satellite imaging, aerial photography and remote sensors, users gain a detailed perspective on land and infrastructure. As urban populations grow and spread, the importance of GIS lies in its ability to pull together the vast amounts of information necessary to balance competing priorities and solve complicated problems, such as optimizing new building placement or determining the feasibility of a waste disposal site.
These powerful tools help planners understand the needs of densely populated areas, but they also adapt to examining smaller towns and even informal settlements. The ability to run a variety of queries and analytics on GIS data means experts can evaluate how new construction will fit in with existing infrastructure and meet regulatory demands. Users may spot opportunities for improved resource use, identifying the best locations to harvest solar, wind or geothermal energy.
GIS technology empowers urban planners with enhanced visibility into data. They monitor fluctuations over time, evaluate the feasibility of proposed projects and predict their effects on the environment. GIS software can also show all relevant stakeholders exactly what the changes on the ground will look like to help them make better decisions. For example, GIS planning software may generate visualizations of an area’s current environmental conditions and allow users to draw comparisons between the anticipated results of proposed development plans.
Request Brochure
Fill out the information below to learn more about the University of Southern California’s GIS Graduate Programs and download a free brochure. If you have any additional questions, please call 213-325-2474 to speak to an enrollment specialist.
The Importance of GIS in Today’s Cities
Urban planners in both the public and private sector employ data-driven methods to address a wide array of issues that have long-term implications for communities and the surrounding landscape.
Common urban planning applications for GIS include:
Review and analysis for land use planning.
Checks on regulatory compliance.
Review of environmental impact.
Preservation of historic sites.
Regional planning beyond the borders of a city or town.
Mapping the delivery of utilities and planning for service interruptions.
By performing analyses, land use planners can guide new developments to areas that are less prone to damage from natural disasters. Synthesizing geographic information with financial data might lead to revitalizing an urban area in need of new businesses.
For example, GIS software allowed the City of San Antonio Planning Department to collaborate with other stakeholders in the initial stages of the ongoing efforts to redevelop the Broadway Corridor. GIS offers the means to synthesize information from a diverse set of sources, model the outcomes of multiple courses of action and share data among the San Antonio Public Works Department, the Alamo Area Council of Governments, a group of architects and Environmental Protection Agency staff in Dallas and Washington, D.C. Experts from many different disciplines found common ground and created actionable plans for making services and amenities more accessible and travel easier for bikers and pedestrians.
Opportunities for Increased Earning Potential in GIS Planning
Urban planning is a rewarding field that is full of chances to discover fresh insights and make a difference in the futures of communities. According to 2023 data from Lightcast, urban planners make a median salary of $79,539, and opportunities are expanding. A GIS education can increase your earning potential in the field — for example, GIS planners (urban planners with GIS skills) make an average of $98,738 per year.
Urban planners commonly work as independent contractors employed by government agencies, private firms and developers. The professionals who succeed in this role are highly capable problem-solvers with excellent spatial reasoning. They should thoroughly understand how a city’s infrastructure functions and account for all applicable laws and demographic information.
Planners should also be proficient communicators who can explain important issues to non-experts. They often must work with stakeholders who may have different priorities, so they should be able to consider multiple perspectives and seek compromises. Urban planners who are experts in GIS can meet these demands with the power of expansive data and a vivid look into the possibilities for their projects.
About USC’s GIS Graduate Programs
The University of Southern California offers a comprehensive selection of online and residential GIS programs. This includes both GIS master’s degrees and GIS graduate certificates. Click on the programs below to learn about our leading geographic information science education.


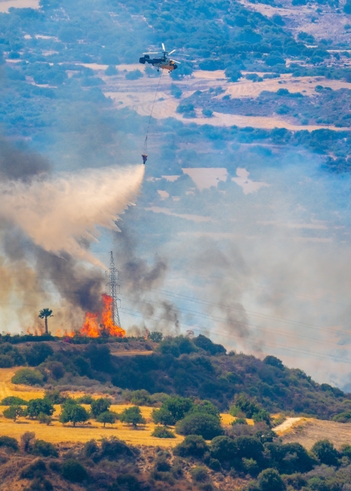
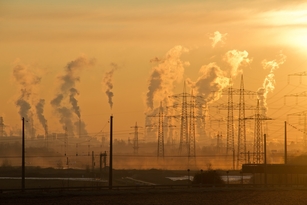

 Organizations rely on geographic information science (GIS) for applications ranging from
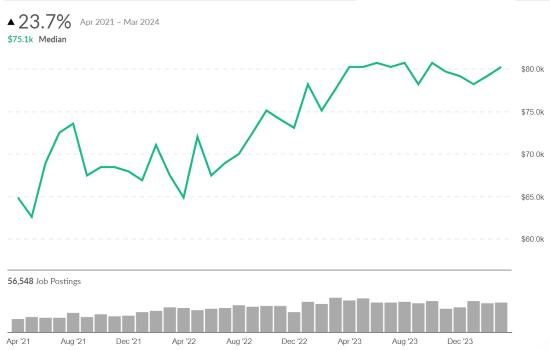
 The GIS market is projected to reach $134.23 billion by 2030, according to an
  Cities are systems of tremendous, ever-evolving complexity. Responsibly guiding an area’s development requires spatial information that’s robust, nuanced and constantly updated, as well as the problem-solving skills to apply that information. This challenge has made geographic information science and technology (GIST) invaluable to urban planners.