How Do GIS Applications Transform Our Response to Climate Change?
Developments in geographic information science (GIS) have transformed how researchers in a variety of fields gather and analyze information about the world around us. Scientists gain valuable insights in areas such as geology and meteorology by gathering remote sensed data and implementing geospatial tools. The perspective offered by GIS technology and methods can be particularly important in studying global climate change.
According to NASA, the Earth’s average surface temperature has increased by approximately 1.62 degrees Fahrenheit since the late 19th century. Scientists attribute problems like extreme weather events, rising sea levels and diminished ice sheets and glaciers to the emission of carbon dioxide and other greenhouse gases into the atmosphere. The Fifth National Climate Assessment, released by the U.S. Global Change Research Program in November 2023 (revised June 2024, predicted long-term consequences such as:
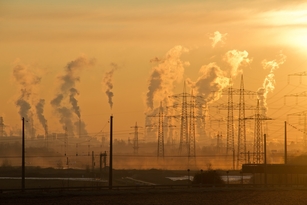
- Worsening air quality
- More frequent and severe extreme weather events
- A decline in crop production
- Greater incidence of food and waterborne diseases
- An increase in heat-related deaths in the U.S.
- A greater impact disparity of climate change on underserved communities
- Diminished populations of underwater creatures due to ocean acidification
There are a multitude of GIS applications in climate change. Using GIS techniques and software, experts can closely monitor these dangers. Robust geospatial data and detailed visualizations offer guidance for organizations and government agencies as they plan for the challenges ahead. By bringing together GIS and climate change studies, spatial problem-solvers can seize opportunities to make a difference in the lives of future generations.
Request Brochure
Fill out the information below to learn more about the University of Southern California’s GIS Graduate Programs and download a free brochure. If you have any additional questions, please call 213-325-2474 to speak to an enrollment specialist.
How Is GIS Used in Climate Change Research?
Climate scientists gather vast amounts of data to track environmental problems and investigate the causes. Spatial reasoning is crucial for analyzing and synthesizing findings from sources such as remote sensors and satellite imagery. Researchers draw on geographic information systems to reveal how the planet has changed through the years, predict the transformations that are yet to come, and communicate what they learn to policymakers and the public.
Continuing advances in GIS technology have established mapping as a crucial means of identifying connections between the state of the climate and other areas of concern. Open-source databases allow for unprecedented collections of spatial information, and high-speed data processing reveals changing conditions in real time.
What Types of Climate Questions Can GIS Help Answer?
Some of the ways that researchers are using GIS for information on climate change include:
- Locating areas where temperatures are particularly high or especially erratic in comparison with the global average
- Discovering how natural atmospheric processes might affect global warming
- Creating models to show how a warming climate might impact the ecology of various regions
- Examining the relevance of shifts in land cover, such as the removal of trees, to climate change
- Visualizing multiple factors with the potential to affect crop growth, industry, wildlife and much more
- Analyzing historical precipitation and risk data
- Mapping vulnerable roads, bridges, and infrastructure
- Supporting first responders with real-time hazard maps
- Guiding recovery efforts such as rebuilding and restoration
- Creating visualizations to show how people and businesses are using power
- Gaining visibility into a region’s available natural resources
- Positioning windfarms to maximize efficiency while avoiding harm to bird populations
- Noting the best locations for raising crops that yield biomass to be used as fuel
- Evaluating whether a building receives sufficient sunlight to be a good choice for solar panel installation
- Master of Science in Geographic Information Science and Technology (GIST) – Online and Residential
- Master’s in Geodesign, Environment and Health – Residential
- Master of Science in Human Security and Geospatial Intelligence – Online and Residential
- Master of Science in Spatial Data Science – Online and Residential
- Master of Science in Spatial Economics and Data Analysis – Online and Residential
- Master of Arts in Global Security Studies – Residential
- Graduate Certificate in Geographic Information Science and Technology (GIST) – Online and Residential
- Graduate Certificate in Geospatial Intelligence – Online and Residential
- Graduate Certificate in Geospatial Leadership – Online and Residential
- Graduate Certificate in Remote Sensing for Earth Observation – Online and Residential
Geospatial tools offer perspective on evolving weather patterns, rising sea levels and growing risks to human health. Informative visualizations show these developments in ways that scientists and non-experts alike can understand. In turn, local governments, nonprofits and other organizations apply what they learn from geographic models to set strategy and make informed decisions.
How Does GIS Support Climate Change Disaster Response?
Scientists have linked the warming climate to extreme weather like floods, droughts, heat waves and hurricanes. Evidence suggests that increasing global temperatures may make these events more frequent and severe. Geospatial methods improve our understanding of how climate change affects weather patterns and can warn communities of dangers to infrastructure, residents and property.
For example, a study from the Pennsylvania Department of Transportation set out to examine the state’s history of flooding, construct a framework to account for the climate’s impact on future storms and predict problems that might occur due to extreme weather. Similarly, the Bureau of Transportation Statistics (BTS) has provided support to help the National Center of Atmospheric Research develop a Roadway Flood Severity Index (RFSI). This index is intended to predict and assess the impact of flood-related disruptions on transportation infrastructure. Researchers used GIS to analyze relevant information such as historical precipitation data and risk assessment scores for roads and bridges and generate visualizations.
How Is GIS Used Before, During and After Extreme Weather Events?
When extreme weather does strike, geospatial intelligence provides support for first responders and recovery workers. Hazard maps based on remote sensing data and satellite imagery keep government officials informed about current conditions and what areas have the greatest need of urgent attention. Response teams provide updates and photos from the ground, leading to efficient and effective crisis management. After a major storm or fire is under control, geographic information guides utility companies as they restore service and assists in the planning processes for replanting crops or rebuilding structures.
In this area, key GIS applications include:
How Can GIS Guide Renewable Energy and Climate Mitigation Strategies?
To address climate change, many local governments, nonprofit organizations and businesses have committed to reducing their dependence on fossil fuels. Establishing sustainable systems that put alternative energy sources to work depends on robust data and close monitoring. That is why many organizations employ GIS to solve the spatial problems involved in minimizing their carbon footprints.
Some applications for geospatial tools and analysis in harnessing green energy are:
About USC’s GIS Graduate Programs
The University of Southern California offers a comprehensive selection of online and residential GIS programs. This includes both GIS master’s degrees and GIS graduate certificates. Click on the programs below to learn about our leading geographic information science education.
GIS Master’s Degrees
GIS Graduate Certificates
Ready to take the next step?
Start your application.
Ready to deepen your expertise in geospatial technologies and expand your career opportunities?
Learn more about USC’s GIS programs.
Catalina Island Excursion
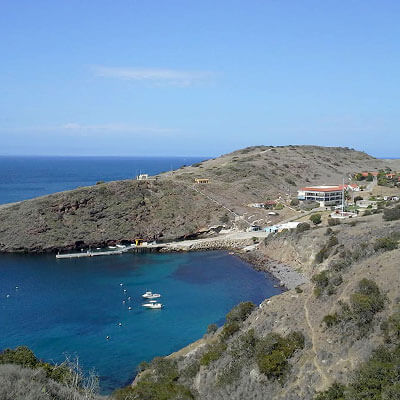
Students in the M.S. in GIST, M.S. in HSGI and Graduate Certificate in GIST programs will participate in a week-long fieldwork excursion...